Image Details
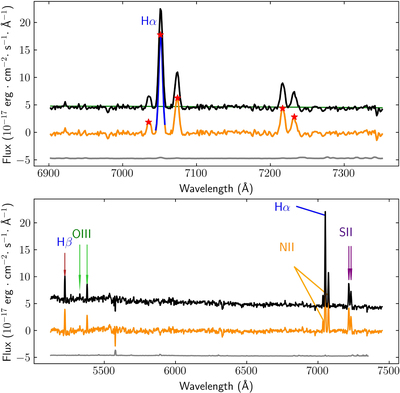
Caption: Figure 4.
MMT Hectospec spectrum of one galaxy. The upper panel shows the wavelength range around the Hα emission line and the lower panel shows a wider wavelength range. The science spectrum is in black and the continuum-subtracted spectrum is in orange. The error spectrum is in gray and has been vertically shifted by –5 for clarity. The red stars in the upper panel indicate the peaks of the identified emission lines.
Other Images in This Article

Copyright and Terms & Conditions
© 2022. The Author(s). Published by the American Astronomical Society.
Copyright ©
2026 Astronomy Image Explorer. All Rights Reserved.