Image Details
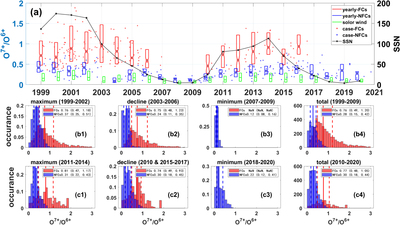
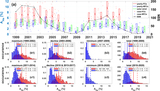
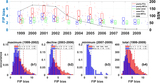
Caption: Figure 4.
The yearly median O7+/O6+ of FCs and NFCs (top panel) and O7+/O6+ histograms for FCs and NFCs during different phases of solar cycles 23 (middle panel) and 24 (bottom panel). The SSNs are denoted by black lines on the top panel, and the red, blue, and green represent FCs, NFCs, and solar wind, respectively. The solid vertical lines in panels (b1)–(b4) and (c1)–(c4) denote the median O7+/O6+, and the dotted vertical lines represent lower and upper quartiles.
Other Images in This Article
Copyright and Terms & Conditions
© 2022. The Author(s). Published by the American Astronomical Society.
Copyright ©
2026 Astronomy Image Explorer. All Rights Reserved.