Image Details
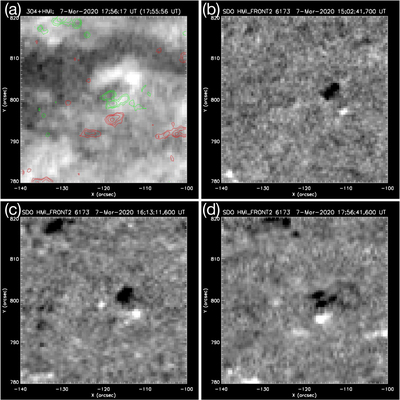
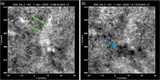
Caption: Figure 7.
Magnetic field evolution at the base of event 5. Panel (a) shows positive (red) and negative (green) contours from a Helioseismic and Magnetic Imager (HMI) line-of-sight magnetogram at 17:55:56 UT on 2020 March 2, as contours with levels set at 30 and 50 G. This is overlaid onto a grayscale version of an 304 Å image within seconds of that in Figure 6(e) (the field of view here is more zoomed in than shown in Figure 6(e)), just as the minifilament is erupting. That erupting minifilament plausibly formed and was ejected from the neutral line of the two closest opposite-polarity strong-flux patches. Panels (b)–(d) show the line-of-sight HMI magnetograms of the location evolving over time, with positive and negative polarities represented by white and black, respectively (contours in (a) are within a minute of (d)). These panels show that the two opposite-polarity patches that may have caused the minifilament eruption converged toward each other in the hours prior to that eruption. Such flux convergence (and cancellation) is commonly observed to occur leading up to minifilament eruptions that produce typical coronal jets. The FOV here is slightly smaller than that of the AIA images in Figure 6, in order to center the bipolar flux patches better.
Other Images in This Article
Copyright and Terms & Conditions
© 2022. The Author(s). Published by the American Astronomical Society.