Image Details
Caption: Figure 4.
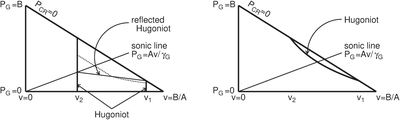
Left: schematic diagram of shock propagation in the pressure–velocity space for γ G = γ CR = 5/3, M = 1.972. Gas pressure P G is plotted on the y-axis, and velocity on the x-axis. Cosmic ray pressure P CR = 0 delineates the third side of the triangle as shown. The Hugoniot is represented by the two thick vertical lines at u 1 (upstream) and u 2 (downstream), and the reflected Hugoniot runs from the intersection of the downstream Hugoniot and the sonic line and the intersection of the upstream Hugoniot and the P CR = 0 line. The dotted curve shows the trajectory of plasma with a nonzero P CR, following the adiabatic gas law from its initial position until it hits the reflected Hugoniot, and then making the shock jump to the downstream Hugoniot. Right: schematic diagram of shock propagation in the pressure–velocity space with cosmic rays trapped at the shock, i.e., with zero cosmic ray energy flux. The Hugoniot is now the curve shown, and coincides with the reflected Hugoniot.
Other Images in This Article
Copyright and Terms & Conditions
© 2022. The Author(s). Published by the American Astronomical Society.