Image Details
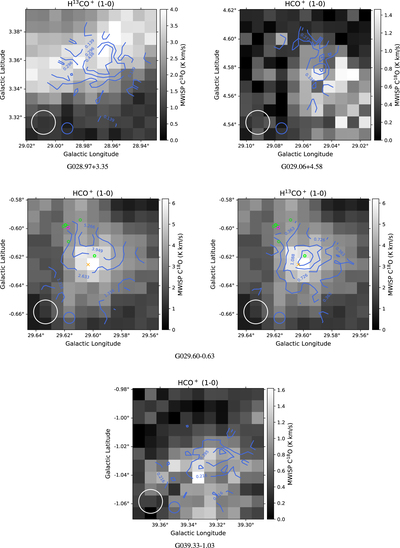
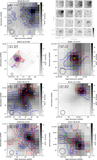
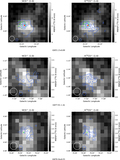
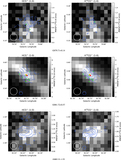
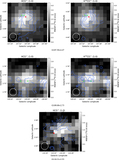
Caption: Figure A1.
HCO+ (1-0) and H13CO+ (1-0) integrated intensity contour (blue) maps superposed on the C18O (1-0) integrated intensity image (C18O data from the MWISP project). The white and blue circles on the lower left indicate the beam sizes of the DLH 13.7 m telescope and the IRAM 30 m telescope, respectively. The green circles denote YSOs from AllWISE data. The magenta circles denote IRAS sources. The red squares denote the star-forming regions. The orange crosses denote the maser sources.
Other Images in This Article
Show More
Copyright and Terms & Conditions
© 2021. The American Astronomical Society. All rights reserved.
Copyright ©
2025 Astronomy Image Explorer. All Rights Reserved.