Image Details
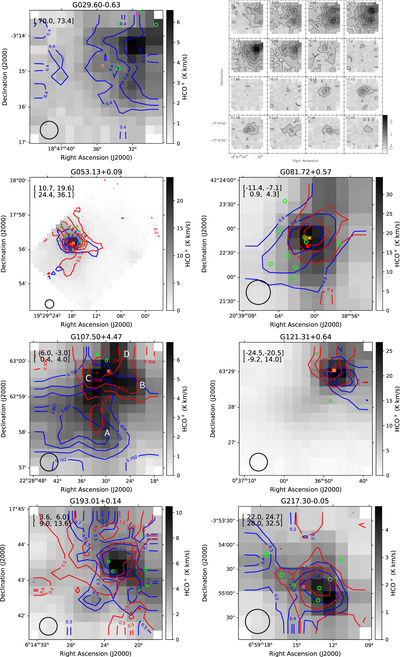
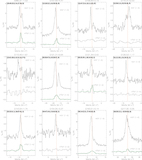
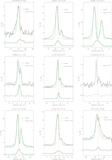
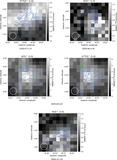
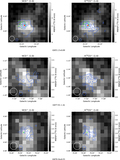
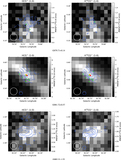
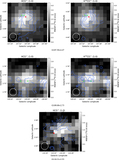
Caption: Figure 5.
The integrated intensity contour of the line wing of the sources with outflow characteristics, superposed on the HCO+ integrated intensity image (the velocity range is marked on the images). The black circles indicate the beam sizes of the IRAM 30 m telescope. The green circles denote YSOs from AllWISE data. The magenta circles denote IRAS sources. The red squares denote the star-forming regions. The orange crosses denote the maser sources. Top right panel: channel map of G029.60-0.63 HCO+ (1-0) lines from 72.6 km s−1 to 82.5 km s−1.
Other Images in This Article
Show More
Copyright and Terms & Conditions
© 2021. The American Astronomical Society. All rights reserved.
Copyright ©
2025 Astronomy Image Explorer. All Rights Reserved.