Image Details
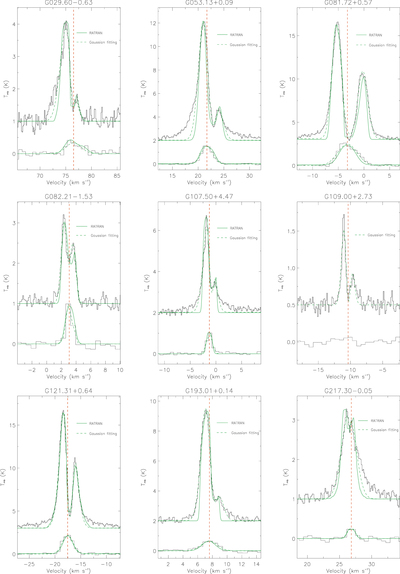
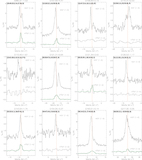
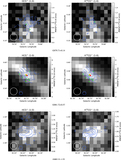
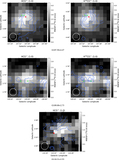
Caption: Figure 4.
HCO+ (10) spectra obtained from RATRAN modeling of a collapsing cloud (see text). The observed HCO+ (10) spectrum is plotted in black, and the position of the spectrum is shown in columnd 2 and 3 of Table 5. The dashed green line is the spectrum obtained by the RATRAN model, and the green line is the result of Gaussian fitting of HCO+ (10). The dashed red line indicates the central radial velocity of H13CO+.
Other Images in This Article
Show More
Copyright and Terms & Conditions
© 2021. The American Astronomical Society. All rights reserved.
Copyright ©
2025 Astronomy Image Explorer. All Rights Reserved.