Image Details
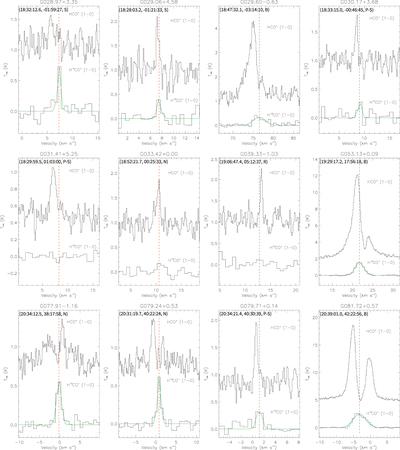
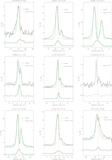
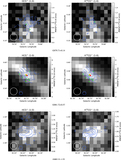
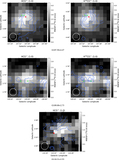
Caption: Figure 3.
Extracted spectra of HCO+ (1-0) and H13CO+ (1-0) from the mapping images. The selected positions are where the asymmetry of the line profiles are obvious (the extraction point coordinates and line-profile types are marked on the upper left corner of each figure). The green line is the result of Gaussian fitting of H13CO+ (1-0) and the dashed red line indicates the central radial velocity of H13CO+ (1-0) (If H13CO+ emissions are not detected, we use C18O data to track the central radial velocity). The HCO+ (1-0) profiles are evaluated: B denotes a blue asymmetric double-peaked profile, P-S denotes a peak-shoulder profile, S denotes a single-peaked profile with the peak skewed to the blue, R denotes a red profile, and N denotes a symmetric line profile or multi-peaked profile.
Other Images in This Article
Show More
Copyright and Terms & Conditions
© 2021. The American Astronomical Society. All rights reserved.