Image Details
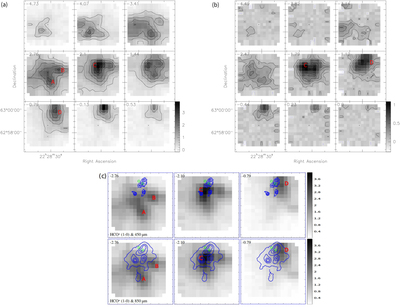
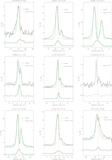
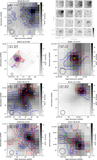
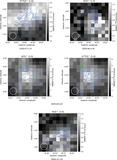
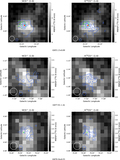
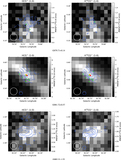
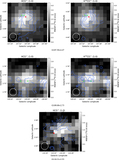
Caption: Figure 2.
Panel (a): Channel maps of G107.50 + 4.47 HCO+ (1-0) lines from −4.73 km s−1 to 0.53 km s−1. Panel (b): Channel maps of G107.50 + 4.47 H13CO+ (1-0) lines from −4.49 km s−1 to 0.90 km s−1. Panel (c): The 450 μm and 850 μm continuum data from SCUBA-2, superposed on the HCO+ channel maps (velocities are −2.76, −2.10, and −0.79 km s−1, respectively. The green circles denote Class 0/I YSOs from AllWISE data.).
Other Images in This Article
Show More
Copyright and Terms & Conditions
© 2021. The American Astronomical Society. All rights reserved.
Copyright ©
2025 Astronomy Image Explorer. All Rights Reserved.