Image Details
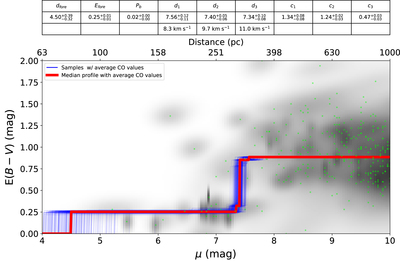
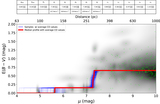
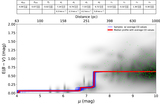
Caption: Figure 5.
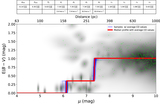
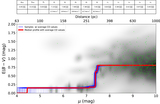
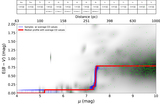
Line-of-sight reddening profile for the B5 star-forming region. The full profile is integrated out to μ = 19 mag (see Figures 2 and 3), but for illustrative purposes we only show the reddening profile in the range 4 mag < μ < 10 mag. The red line indicates the reddening profile parameterized by the median of the samples for each parameter (summarized in the table above the figure), derived from our dynesty run. Since the magnitude of the reddening jump depends on the amount of CO emission, we have taken the average of the CO emission in each slice to obtain an estimate of the reddening to B5. The blue lines are random samples from the same chain used to derive the median. In the background grayscale, we show distance–reddening stellar posteriors used in the parameter estimation (see G18), stacked on top of one another. We plot the most probable distance–reddening position for each star as a lime green scatter point, obtained by extracting the cell with the maximum probability in each of the gridded stellar posteriors. These lime green points are shown only for reference and are not used in the fit, which always integrates through the full posterior for each star.
Other Images in This Article
Show More
Copyright and Terms & Conditions
© 2018. The American Astronomical Society. All rights reserved.