Image Details
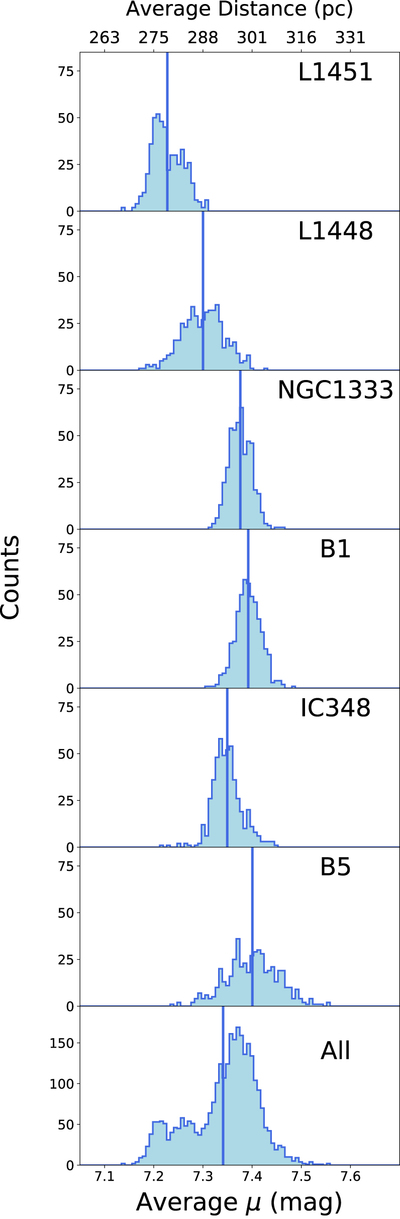
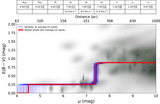
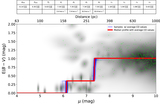
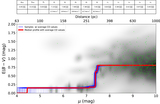
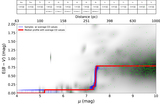
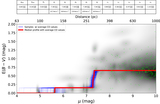
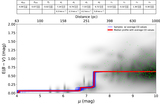
Caption: Figure 4.
Monte Carlo realizations of the average reddening-weighted distance to each cloud as described at the beginning of Section 7. Each “count” is a reddening-weighted average distance computed using Equation (7). From top to bottom, the panels are sorted in order of increasing R.A. We report the mean of the distribution in each panel (vertical blue lines) as the final overall average distance to each star-forming region in Table 3. Likewise, the uncertainty we report in Table 3 is the standard deviation of each distribution. An average distance and distance uncertainty for the Perseus complex as a whole (bottom panel) is computed by stacking the average distances to individual regions in the first six panels.
Other Images in This Article
Show More
Copyright and Terms & Conditions
© 2018. The American Astronomical Society. All rights reserved.