Image Details
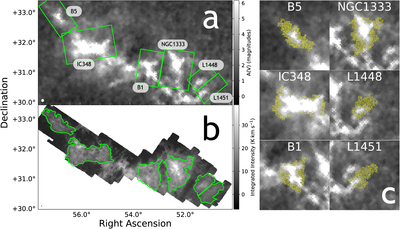
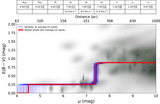
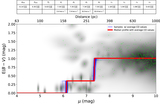
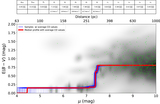
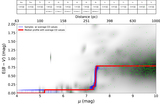
Caption: Figure 1.
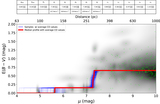
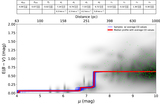
(a) The Perseus Molecular Cloud, as seen in visual extinction (Pineda et al. 2008). We frame each region of interest (B5, IC 348, B1, NGC 1333, L1448, and L1451) via the green rectangles. The beam size (5′) is shown in white in the bottom left corner. (b) The Perseus Molecular Cloud, as seen in integrated 12CO emission (Ridge et al. 2006). The beam size (46″) is shown in black in the bottom left corner. To delineate boundaries around the cloud, we apply integrated intensity contours to this map (at ≈5–15 K km s−1, depending on the region) and find the intersection between these contours and the classical regions of extinction, as shown in panel (a). The final boundaries are shown via the green polygons in panel (b). (c) The positions of the stars (yellow scatter points) considered in our analysis for each region, after masking out lines of sight with high extinction (A(V) > 4 mag). An additional cut is also made to remove stars with the worst chi-squared values.
Other Images in This Article
Show More
Copyright and Terms & Conditions
© 2018. The American Astronomical Society. All rights reserved.