Image Details
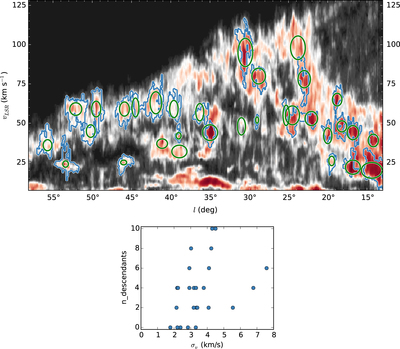
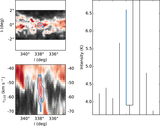
Caption: Figure 3.
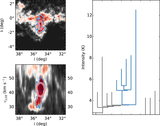
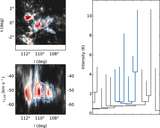
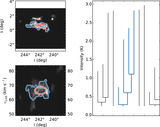
Illustration of the selection of dendrogram emission structures corresponding to the Dame et al. (1986) clouds in the first quadrant, and their relevant properties. Top: zeroth-moment map along the latitude axis of the first quadrant survey. Green ellipses show the location and extent of the Dame et al. (1986) clouds, while the blue contours show the extent of the emission region that is identified with each Dame et al. (1986) cloud. An accounting of non-matches between the blue contours and green ellipses is given in Footnote 4. Bottom: scatter plot of the 28 clouds, showing n_descendants vs. σv. The cloud definitions presented in Section 2.3 are derived in part from this analysis.
Other Images in This Article
Show More
Copyright and Terms & Conditions
© 2016. The American Astronomical Society. All rights reserved.