Image Details
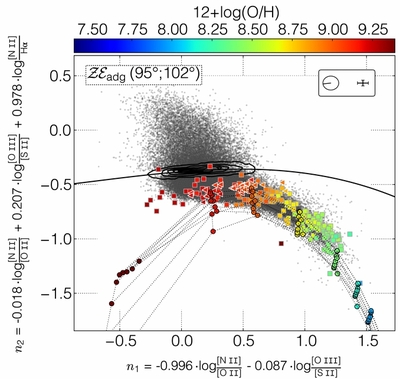
Caption: Figure 3.
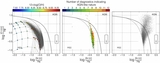
 adg(95°; 102°) diagram. The diagram name and associated values of (ϕ*, θ*) are shown in the top left corner for completeness. H II-like and AGN-like SDSS galaxies are in gray. Uncertain galaxies (based on all
  diagnostics) are represented by density contours (5%, 20%, 40%, and 80% of the maximum density). The round colored dots (connected by the dotted lines) correspond to the MAPPINGS IV models from Dopita et al. (2013). These provide guidance about the theoretical shape of the H II region space. The van Zee et al. (1998) points are represented by small squares with 75% opacity and the measurements from NGC 5427 are marked with small triangles. All measured H II regions are color-coded according to their oxygen abundance. The black thick line traces our diagnostic line separating the H II-like objects from the AGN-like ones, for which we adopt a third degree polynomial functional form. The black cross (top right) indicates the median error associated with the given combination of SDSS flux ratios, and the circle-and-bar symbol marks the intensity and direction (taken from the circle center outward) of the displacement associated with Rαβ = 3.1 instead of 2.86.
Other Images in This Article

Show More
Copyright and Terms & Conditions
© 2014. The American Astronomical Society. All rights reserved.