Image Details

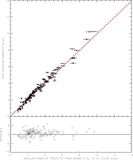
Caption: Figure 5.
Top panel: comparison of the angular diameters measured here vs. diameters predicted using the relations from the Mozurkewich et al. (2003) paper (Equations (3) and (4) in Section 6). Note that the NPOI errors are often smaller than the open circle indicating the data point, and are almost universally much smaller than that predicted using (V − K) color. The black dashed line is the 1:1 ratio, and the solid red line is the linear fit to the data (f(x) = 1.001x + 0.068). Bottom panel: the residuals to the 1:1 fit, calculated as described in Figure 3.
Other Images in This Article


Copyright and Terms & Conditions
© 2023. The Author(s). Published by the American Astronomical Society.
Copyright ©
2025 Astronomy Image Explorer. All Rights Reserved.