Image Details

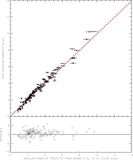
Caption: Figure 3.
Top panel: comparison of the angular diameters measured here vs. previously measured interferometric diameters from the literature. The error bars are included but are often smaller than the open circle indicating the measurement. The dotted line is the 1:1 ratio. When more than one measurement was available in the literature, we used the most recent measurement (see Table 8). Bottom panel: the residuals were calculated as follows: (﹩{\theta }_{\mathrm{NPOI}}-{\theta }_{\mathrm{literature}})﹩ × (combined error)−1.
Other Images in This Article


Copyright and Terms & Conditions
© 2023. The Author(s). Published by the American Astronomical Society.
Copyright ©
2025 Astronomy Image Explorer. All Rights Reserved.