Image Details

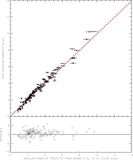
Caption: Figure 2. Diameter fits including limb darkening
The complete figure set (33 images) is available in the online journal.
Top panel: the θ LD fit for HD 3712/α Cas. The solid red line represents the visibility curve for the best fit θ LD, the points are the calibrated visibilities, and the vertical lines are the measurement uncertainties. Bottom panel: the residuals (O − C) of the diameter fit to the visibilities.
Other Images in This Article


Copyright and Terms & Conditions
© 2023. The Author(s). Published by the American Astronomical Society.
Copyright ©
2025 Astronomy Image Explorer. All Rights Reserved.