Image Details
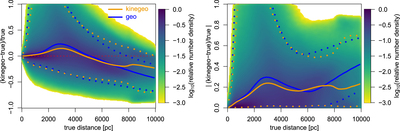
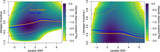
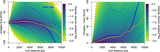
Caption: Figure 7.
Performance of the kinegeometric distance estimate (median of the posterior) as a function of distance for the constant fraction sample in the mock catalog. The left panel shows the fractional bias in the estimates. The right panel shows the fractional scatter. The color scale shows the density of stars on a log scale. The solid orange line shows the median bias or scatter at each distance; the dotted lines are the 5th and 95th percentiles. The blue lines show the same metrics for the geometric distances, for comparison.
Other Images in This Article
Show More
Copyright and Terms & Conditions
© 2023. The Author(s). Published by the American Astronomical Society.
Copyright ©
2025 Astronomy Image Explorer. All Rights Reserved.