Image Details

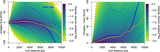
Caption: Figure 20.
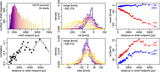
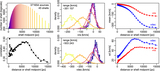
Demonstration of how the proper motion likelihood (P(μ∣r, v), orange) combines with the velocity prior (P(v∣r), blue) to constrain the distance via Equation (A1), from a measured proper motion of 1 ± 0.25 mas yr−1. This is shown for two different velocities, 10 and 30 km s−1. The gray curve is the product of the orange and blue curves. The black dashed line is the integral in Equation (A1) computed for a continuous range of velocities. None of these functions are probability density functions in r, but all have been normalized to unit area over the range plotted.
Other Images in This Article
Show More
Copyright and Terms & Conditions
© 2023. The Author(s). Published by the American Astronomical Society.
Copyright ©
2025 Astronomy Image Explorer. All Rights Reserved.