Image Details

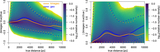
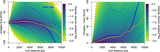
Caption: Figure 19.
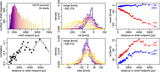
Median performance of the geometric (blue) and kinegeometric (orange) distance estimates as a function of distance for the constant fraction sample in the mock GDR3 (solid) and mock GDR5 (dashed) catalogs. The left panel shows the fractional bias in the estimates. The right panel shows the fractional scatter. The solid lines are the same as those in Figure 7.
Other Images in This Article
Show More
Copyright and Terms & Conditions
© 2023. The Author(s). Published by the American Astronomical Society.
Copyright ©
2025 Astronomy Image Explorer. All Rights Reserved.