Image Details
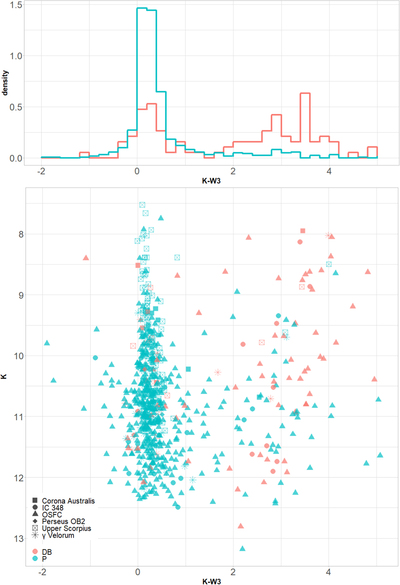
Caption: Figure 7.
Distribution of 706 candidates to P or DB classes proposed by the algorithm. In the upper panel we have a density histogram of the color of both classes giving an estimation of their probability densities. In the bottom panel we show a color–magnitude diagram using K and W3 bands obtained from the AllWISE catalog (Cutri et al. 2021), and selected to have a profile-fit flux signal-to-noise ratio over 2, and discarding those with possible contamination or bias due to proximity to an image artifact. The number of members in each star-forming region is distributed as follows: 457 stars in OSFC, 112 in Upper Scorpius, 60 in γ Velorum, 49 in IC 348, 19 in Corona Australis, and nine in Perseus OB2. The color–magnitude diagram shows that the behavior of the infrared excess of both classes occurs among all regions we studied.
Other Images in This Article

Copyright and Terms & Conditions
© 2023. The Author(s). Published by the American Astronomical Society.