Image Details
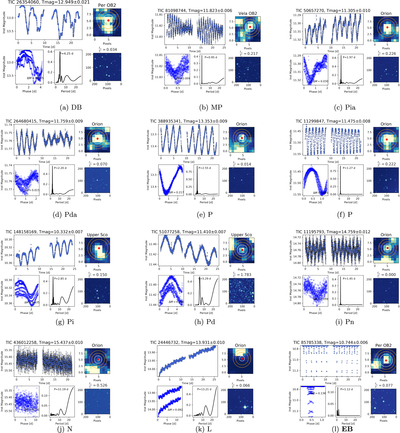
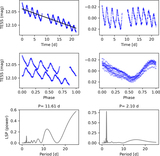
Caption: Figure 6.
Selected LCs of single-classed stars in the testing sample. The proposed morphology class is made by the final algorithm and confirmed by the visual revision. For each plot from left to right at the top: (A) Light curve in TESS magnitudes with a representative error bar. The legend at the top refers to the star identification, the mean TESS magnitude, and the uncertainty. (B) Field of view (210 × 210 arcsec2) corresponding to a TESS image of 10 × 10 pixels. The white circle shows the photometric aperture, and the orange circles the sky annulus. The red dot marks the centroid of the star. In the bottom panels from left to right: (C) Phase-folded light curve to the estimated best period. ΔM shows the amplitude. (D) Lomb-Scargle periodogram, with the estimated period. (E) 210 × 210 pixels Digital Sky Survey (DSS2) thumbnail, same field of view as (B). ﹩\tfrac{{F}_{{in}}}{{F}_{* }}﹩ shows the contamination level estimator (CLE).
Other Images in This Article

Copyright and Terms & Conditions
© 2023. The Author(s). Published by the American Astronomical Society.