Image Details
Caption: Figure 1.
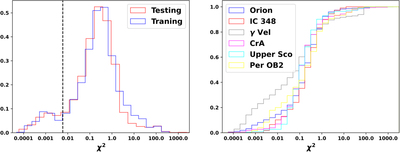
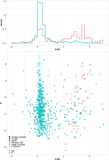
Normalized distributions of χ 2 for our study samples. The left panel shows comparative histograms of χ 2 for the training and testing samples. The dotted vertical line shows the quality cut χ 2 = 0.006, defined as 3σ levels from the minor distribution peak. The right panel shows the cumulative plot of χ 2 per stellar region in the testing sample. The γ Velorum LCs could be more affected by systematic effects than other stellar regions. For example, the quality cut indicates that 30% of γ Velorum LCs are strongly dominated by systematics, while 10% of the LCs in other regions have this problem.
Other Images in This Article

Copyright and Terms & Conditions
© 2023. The Author(s). Published by the American Astronomical Society.