Image Details
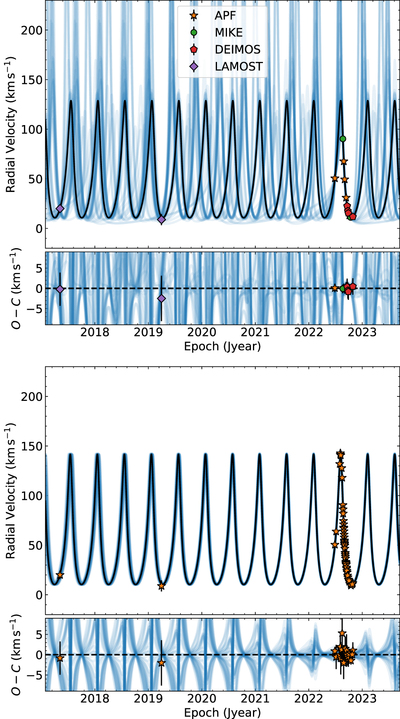
Caption: Figure 9.
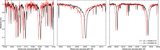
(Top) Radial velocity solution for Gaia DR3 4373465352415301632, for the velocity measurements listed in Table 2. The black curve is the most likely MCMC orbital solution determined from the spectroscopic measurements alone, and the light-blue curves are a random set of MCMC samples. Many periods are consistent with the RV data. (Bottom) Radial velocity solution including data from Table 2 and from El-Badry et al. (2023b). This fit yields a unimodal solution for the period even without incorporating any information from the astrometric solution (0.4% of the points in the chain are at P ≈ 218 day).
Other Images in This Article
Show More
Copyright and Terms & Conditions
© 2023. The Author(s). Published by the American Astronomical Society.