Image Details
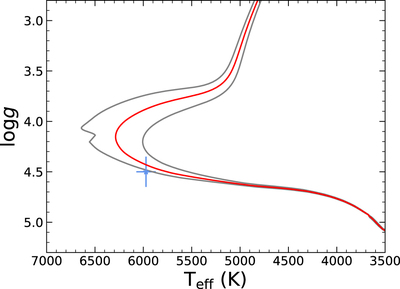
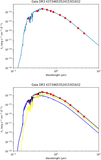
Caption: Figure 7.
Effective temperature and surface gravity of Gaia DR3 4373465352415301632 compared to MIST isochrones. The blue point shows the derived position of the star and the red curve is the 0.91 M ⊙ isochrone that provides the best fit to the combined photometric and spectroscopic data. The gray curves represent 0.89 M ⊙ and 0.93 M ⊙ isochrones for comparison.
Other Images in This Article
Show More
Copyright and Terms & Conditions
© 2023. The Author(s). Published by the American Astronomical Society.
Copyright ©
2025 Astronomy Image Explorer. All Rights Reserved.