Image Details

Caption: Figure 12.
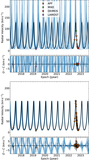
Phase-folded radial velocity curve for the data listed in Table 2 (top) and for all available data (bottom). The black line in the top panel represents the most likely orbit, and the light-blue curves illustrate a random selection of individual MCMC samples. The orbits shown in the top panel are restricted to periods between 175 and 195 days. The residuals, observed minus calculated, are shown in the lower panels. The agreement is within ∼5 km s−1 for all RV measurements, and all χ 2 values indicate satisfactory fits, with χ 2 per degree of freedom below 1 for both data sets.
Other Images in This Article
Show More
Copyright and Terms & Conditions
© 2023. The Author(s). Published by the American Astronomical Society.