Image Details
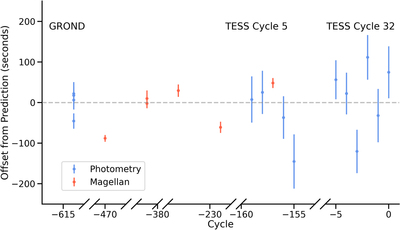
Caption: Figure 16.
The difference between the predicted t 0, found using the t 0 and P from Table 5, and the fit t 0 for both the photometric transits used in Section 3.1 (blue) and our own Magellan transits (red) as given in Table 5. We see no evidence for transit-timing variations in these data.
Other Images in This Article


Show More
Copyright and Terms & Conditions
© 2022. The Author(s). Published by the American Astronomical Society.
Copyright ©
2025 Astronomy Image Explorer. All Rights Reserved.