Image Details
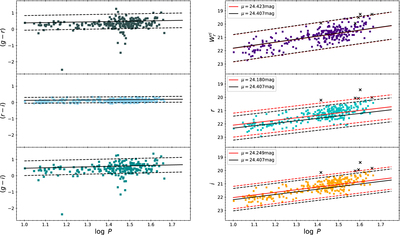
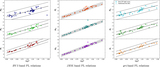
Caption: Figure 8.
Left panel: PC relations for the M31 TIICs, where the colors of the TIICs have been reddening corrected (Kodric et al. 2018). The solid lines are the PC relations given in Table 5, together with the ±3σ boundaries shown as dashed lines. Right panel: the PW relation (top right panel) for the W ri r Wesenheit index, and the extinction-corrected ri-band PL relations (middle right and bottom right panels) for the M31 TIICs. Crosses represent the rejected TIICs as described in the text (see Section 6). Similar to the left panels, the solid lines are the PL/PW relations given in Tables 3 and 4, respectively, shifted vertically with the distance modulus (μ) of M31, and the dashed lines are the corresponding ±3σ boundaries. Black lines are the shifted PL/PW relations by adopting the same μ = 24.407 mag (Li et al. 2021). The red lines represent the PL/PW relations after shifting the μ determined from fitting the data to the PL/PW relations given in Tables 3 and 4. In both panels, error bars are omitted for clarity.
Other Images in This Article
Copyright and Terms & Conditions
© 2022. The Author(s). Published by the American Astronomical Society.