Image Details
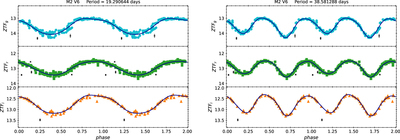
Caption: Figure 1.
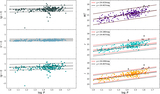
ZTF light curves for V6 in M2 folded with the period determined from LombScargleMultiband (left panel) and twice that of the determined period (right panel). Alternate minima can be seen when the determined period is doubled. The black curves are the fitted low-order Fourier expansion given in Equation (1). Crosses are rejected outliers based on the two-step fitting process (see the text for details).
Other Images in This Article
Copyright and Terms & Conditions
© 2022. The Author(s). Published by the American Astronomical Society.
Copyright ©
2025 Astronomy Image Explorer. All Rights Reserved.