Image Details
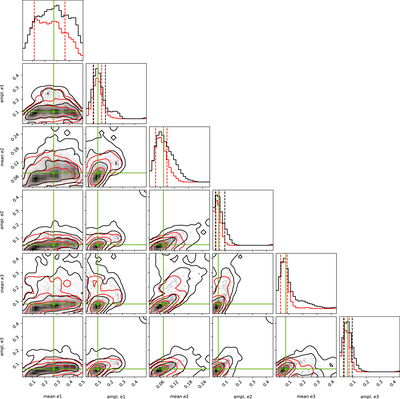
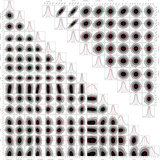
Caption: Figure 4.
Distribution of 1000 randomly sampled NS posteriors integrated for 1 Myr. The black, two-dimensional contours indicate 1, 2, and 3σ confidence intervals of the whole posterior distribution, and the red contours indicate 1, 2, and 3σ confidence intervals for the stable subsample. Only the mean planetary eccentricities and eccentricity amplitudes for all three planets are shown, which are decisive for the system’s stability and dynamical properties. The median values of the total posterior distribution are marked with green lines.
Other Images in This Article
Copyright and Terms & Conditions
© 2022. The Author(s). Published by the American Astronomical Society.
Copyright ©
2026 Astronomy Image Explorer. All Rights Reserved.