Image Details
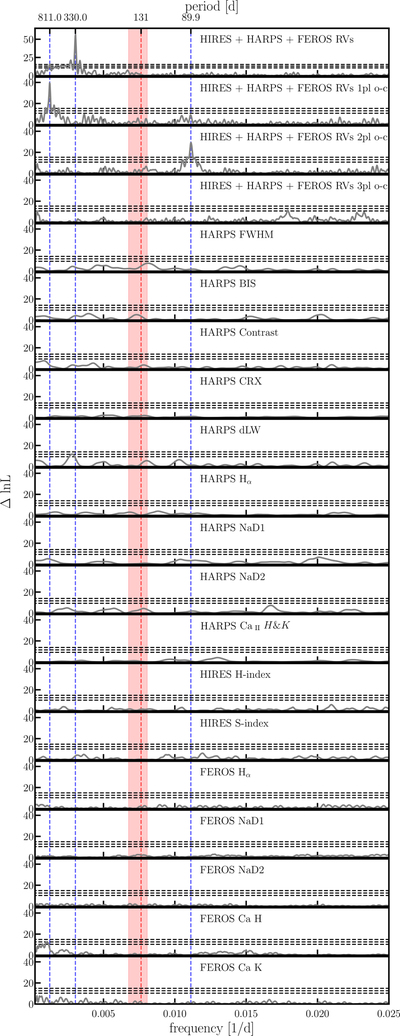
Caption: Figure 2.
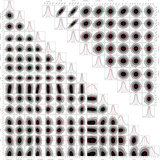
MLP of the combined RV data from HARPS, HIRES, and FEROS, as well as stellar activity indicators. The horizontal lines correspond to the FAP levels of 10% (dotted line), 1% (dotted–dashed line), and 0.1% (dashed line). The orbital periods of the planets are indicated as vertical dashed blue lines and the estimate for the rotation period by Jofré et al. (2015) is shown as a red dashed line, while the red shaded area denotes its uncertainties (see Table 1).
Other Images in This Article
Copyright and Terms & Conditions
© 2022. The Author(s). Published by the American Astronomical Society.
Copyright ©
2025 Astronomy Image Explorer. All Rights Reserved.