Image Details
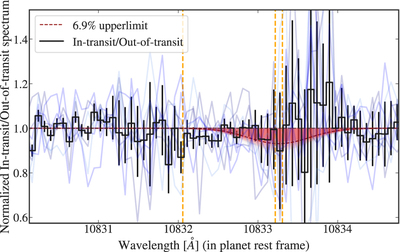
Caption: Figure 8.
Ratio of the in-transit spectra and out-of-transit TOI-3757 spectra. The blue curves are the three individual ratio spectra from the transit epoch, whereas the black curve is the weighted average of the three. The x-axis shows a vacuum wavelength in the planet’s rest frame mid-transit. The rest vacuum wavelengths of the He 10830 Å, triplet lines in planet's rest frame are marked by dashed vertical orange lines. We do not detect any significant absorption in the planetary spectra at these wavelengths. The results of our MCMC fit of the strongest doublet lines in the He 10830 Å triplet using a Gaussian model of width 0.89 Å are shown by the red curves in the lower panel, and the 6.9% upper limit is shown by the dashed red curve overlaid on the MCMC results.
Other Images in This Article

Show More
Copyright and Terms & Conditions
© 2022. The Author(s). Published by the American Astronomical Society.