Image Details
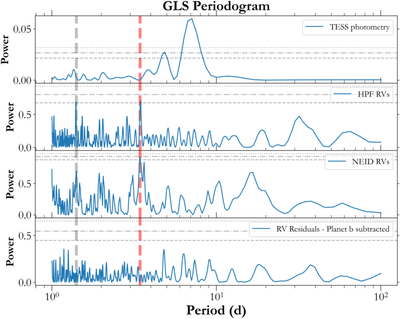
Caption: Figure 4.
GLS periodogram for the different data sets. The horizontal gray lines represent the 0.1%, 1%, and 10% FAP values. The red vertical line depicts the orbital period of planet b, whereas the gray line marks its 1 day alias.
Other Images in This Article
Show More
Copyright and Terms & Conditions
© 2022. The Author(s). Published by the American Astronomical Society.
Copyright ©
2025 Astronomy Image Explorer. All Rights Reserved.