Image Details
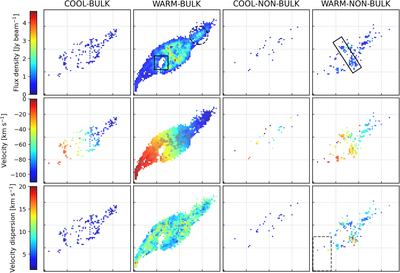
Caption: Figure 9.
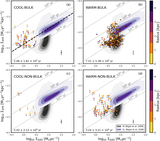
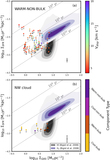
Atlas of kinematic classification of H I gas. The figure shows the maps of flux density, centroid velocity, and velocity dispersion of cool-bulk (V disp ≤ 4.0 km s−1 with bulk motion), warm-bulk (V disp > 4.0 km s−1 with bulk motion), cool-non-bulk (V disp ≤ 4.0 km s−1 with non-bulk motion), and warm-non-bulk (V disp > 4.0 km s−1 with non-bulk motion) gas components. The dashed circle and solid square on the map of warm-bulk flux density represent the NW cloud and the H I shell, respectively. The solid rectangle on the map of warm-non-bulk flux density shows possible candidate HVCs. The points with gray empty boxes on each velocity map present the pixels that have more than one component in the same classification. The black dashed rectangle in the bottom right panel shows the region we disregard in the subsequent analysis.
Other Images in This Article
Copyright and Terms & Conditions
© 2022. The Author(s). Published by the American Astronomical Society.