Image Details

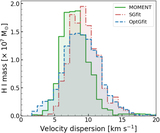
Caption: Figure 8.
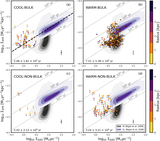
Velocity dispersion histogram extracted from the optimally decomposed Gaussian components (open histogram). The gray-shaded histogram is that for the bulk components. Two Gaussians describe the bimodality of the histogram and they overlap at 4.0 km s−1 (black dotted line). The blue dashed line presents cool-bulk components (v disp < 4.0 km s−1) and the red dashed-dotted line shows the warm-bulk distribution (v disp > 4.0 km s−1).
Other Images in This Article
Copyright and Terms & Conditions
© 2022. The Author(s). Published by the American Astronomical Society.
Copyright ©
2026 Astronomy Image Explorer. All Rights Reserved.