Image Details
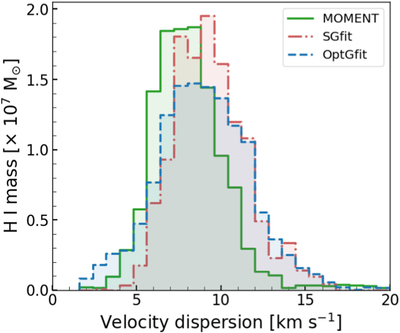
Caption: Figure 6.
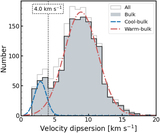
The mass distribution for the velocity dispersions. The bin width of the histogram is 0.8 km s−1. Green, red, and blue bars indicate the H I mass distribution derived from MOMENT0, SGfit, and OptGfit (BAYGAUD) integrated flux density maps, respectively.
Other Images in This Article
Copyright and Terms & Conditions
© 2022. The Author(s). Published by the American Astronomical Society.
Copyright ©
2025 Astronomy Image Explorer. All Rights Reserved.