Image Details
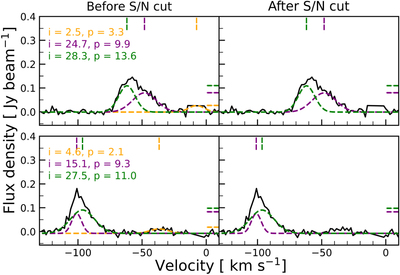
Caption: Figure 3.
Two example profiles (black solid lines) showing the S/N cut adopted in this work. The dashed lines in the left panels show the OptGfit results, and their integrated (“i”) and peak (“p”) S/N values are noted in each panel. The central velocities and flux density values are indicated by the vertical and horizontal lines on the top and right sides of each panel, respectively. The resulting Gaussian components obtained after filtering out the ones with low S/N are shown in the right panels.
Other Images in This Article
Copyright and Terms & Conditions
© 2022. The Author(s). Published by the American Astronomical Society.
Copyright ©
2025 Astronomy Image Explorer. All Rights Reserved.