Latest Images
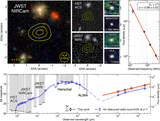
Multi-wavelength observations of the JWST-dark ...
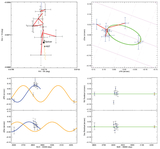
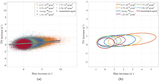
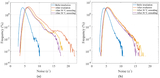
Astrometric fit for CWISEP J023842.60−133210.7....
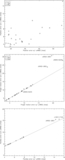
Color–magnitude diagrams for our sample (red po...
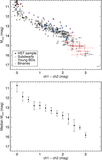
Top: color–magnitude diagram for our sample com...
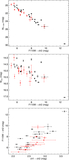
Comparison of the uncertainties on the best-fit...
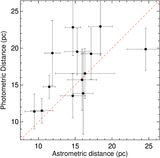
A comparison between our measured astrometric d...
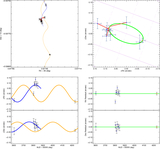
Same as Figure 2, but without using unWISE data.
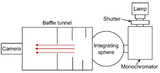
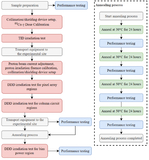
Block diagram of the laboratory testing system.
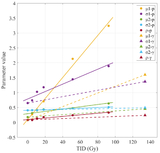
Dependence of probability density function para...
Gain variation with irradiation and annealing i...
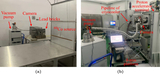
Irradiation test site. (a) 60Co-γ irradiation t...
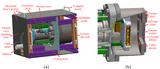
Camera structure model. (a) Model of the overal...
Joint distribution of pixel bias and noise. (a)...
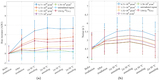
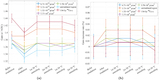
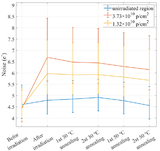
Bias and noise variation curves at different st...
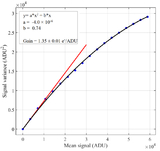
PTC curve and gain fitting analysis.
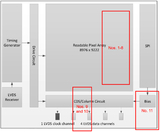
Block diagram of the laboratory testing system....
Pixel TN distribution across stages. The y-axis...
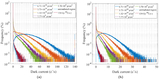
Dark current distribution in different irradiat...
Median TN values of the pixels in the columns c...
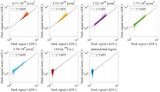
Scatterplots of pixel dark current and dark cur...
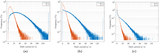
Dark current distribution at different operatin...
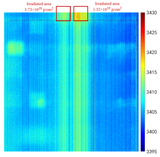
Postirradiation bias image (100 frame average t...
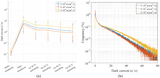
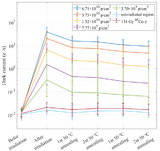
Dark current behavior under different proton ir...
ANNOUNCEMENTS
Take the AstroExplorer for a spin!
Be sure to try the search and sorting features, which were added based on user feedback; browse and find the links to videos and interactive figures in our Journal articles; find AAS Research Notes; or notice that new publishers have begun adding their figures to the AIE. Get in touch to hear more!