Image Details
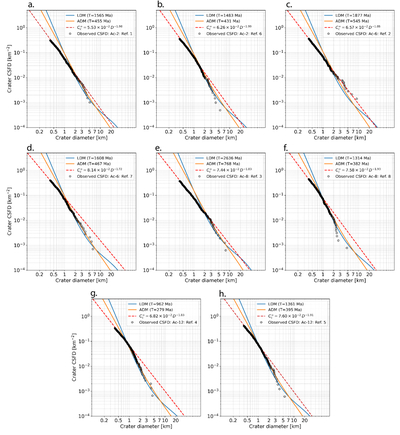
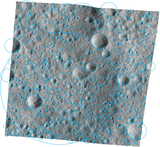
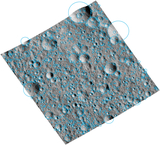
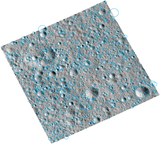
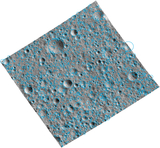
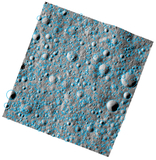
Caption: Figure 2.
Observed and fitted CSFDs for eight counting areas on Ceres. Each panel corresponds to each reference: (a) Reference 1 (Ac-2); (b) Reference 6 (Ac-2); (c) Reference 2 (Ac-6); (d) Reference 7 (Ac-6); (e) Reference 3 (Ac-8); (f) Reference 8 (Ac-8); (g) Reference 4 (Ac-12); (h) Reference 5 (Ac-12). Black circles denote the empirical data from our crater counting, blue and orange curves show the modeled lunar- and asteroid-derived chronology fits (LDM and ADM, respectively), and red dashed lines are the equilibrium state, ﹩{C}_{c}^{\infty }﹩.
Other Images in This Article
Copyright and Terms & Conditions
© 2026. The Author(s). Published by the American Astronomical Society.
Copyright ©
2026 Astronomy Image Explorer. All Rights Reserved.