Image Details

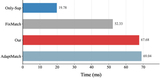
Caption: Figure 7.
Comparison of inference time for different models on HERA and LOFAR datasets. The average inference time per single sample is reported. Red, blue, and gray bars denote our proposed method, the Only-Sup baseline, and comparative methods (AOFlagger, NLN, and RFDL), respectively.
Other Images in This Article
Show More
Copyright and Terms & Conditions
© 2026. The Author(s). Published by the American Astronomical Society.
Copyright ©
2026 Astronomy Image Explorer. All Rights Reserved.