Image Details

Caption: Figure 5.
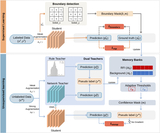
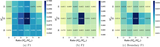
Performance trends of Only-Sup, Full-Sup, and the proposed method on four baseline models (EMSCA-UNet, RFI-Net, R-Net7, and U-Net). Each subplot has two panels: the left shows the F1 score and the right shows the Boundary F1 score. Red circles denote Only-Sup, green squares denote the proposed method, and yellow stars denote Full-Sup.
Other Images in This Article
Show More
Copyright and Terms & Conditions
© 2026. The Author(s). Published by the American Astronomical Society.
Copyright ©
2026 Astronomy Image Explorer. All Rights Reserved.