Image Details
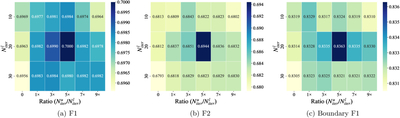
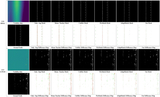
Caption: Figure 10.
Memory bank capacity sensitivity analysis. From left to right, the three heatmaps visualize the grid search results for F1, F2, and Boundary F1 scores. The vertical axis represents the labeled memory bank capacity NL, while the horizontal axis represents the ratio between the unlabeled and labeled memory banks γ. Darker colors indicate better performance.
Other Images in This Article
Show More
Copyright and Terms & Conditions
© 2026. The Author(s). Published by the American Astronomical Society.
Copyright ©
2026 Astronomy Image Explorer. All Rights Reserved.