Image Details
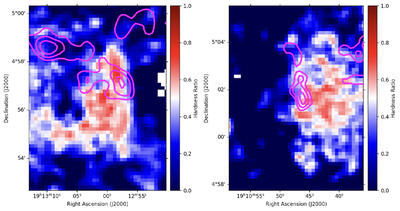
Caption: Figure 4.
Hardness ratio map between the 0.5–1.5 keV and 2.0–7.0 keV bands observed with XMM-Newton (K. Kayama et al. 2022, 2025). The images are regridded to match the spatial grid of the 12CO (J = 1–0) data, as in Figure 3. Magenta contours represent the CO integrated intensity over the same velocity ranges as in Figure 1. For the eastern side, three contour levels are shown from 2.1 to 3.5 K km s−1, while for the western side, six levels are shown from 0.8 to 2.0 K km s−1.
Other Images in This Article

Copyright and Terms & Conditions
© 2026. The Author(s). Published by the American Astronomical Society.
Copyright ©
2026 Astronomy Image Explorer. All Rights Reserved.