Image Details
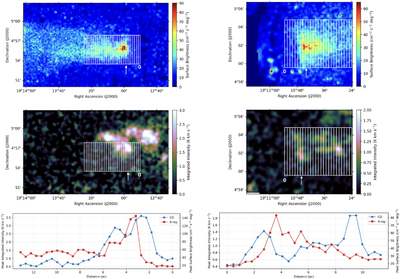
Caption: Figure 3.
Comparison of the spatial distributions of the X-ray surface brightness in the 0.5–10 keV band observed with XMM-Newton (K. Kayama et al. 2022, 2025) and the integrated intensity of 12CO (J = 1–0). The X-ray images are regridded to match the spatial grid of the CO data. The left and right columns correspond to the eastern and western jets, respectively. The top panels show the X-ray surface brightness, and the middle panels show the CO integrated intensity over the same velocity ranges as in Figure 1. The slices shown in the top and middle panels have a width of 17″, corresponding to ∼0.45 pc at a distance of 5.5 kpc. The white arrows indicate the slices where the first peak appears downstream from the X-ray jet head regions. The bottom panels plot the peak values of the CO integrated intensity and X-ray surface brightness within each slice. The horizontal axis represents the distance (pc) from the slice labeled 0 in the top and middle panels.
Other Images in This Article

Copyright and Terms & Conditions
© 2026. The Author(s). Published by the American Astronomical Society.