Image Details
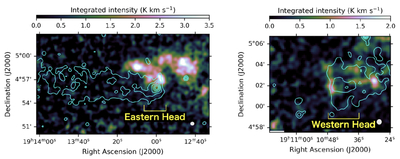
Caption: Figure 2.
Integrated intensity maps of 12CO (J = 1–0). The left and right panels show the eastern and western jet head regions, respectively. The velocity ranges are the same as those in Figure 1. The beam size after smoothing (30″) is shown in the lower right. Cyan contours indicate the X-ray photon flux shown in Figure 1, with five levels ranging from 3.0 × 10⁻⁸ to 1.2 × 10⁻⁷ cm−1 s−1.
Other Images in This Article

Copyright and Terms & Conditions
© 2026. The Author(s). Published by the American Astronomical Society.
Copyright ©
2026 Astronomy Image Explorer. All Rights Reserved.