Image Details
Caption: Figure 1.
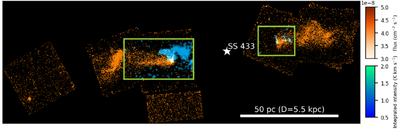
Two-color composite image of the integrated intensity of 12CO (J = 1–0) (cyan) and the X-ray photon flux in the 0.5–7 keV band observed with Chandra (orange; N. Tsuji et al. 2025). The velocity ranges used for the CO integration are 46.5–58.3 km s−1 for the eastern side and 51.7–56.5 km s−1 for the western side. The position of SS 433 is indicated by a white star. The scale bar at the lower right assumes a distance of 5.5 kpc (K. M. Blundell & M. G. Bowler 2004). The light green boxes indicate the regions shown in Figure 2, corresponding to the areas observed with the Nobeyama 45 m Radio Telescope in this study.
Other Images in This Article

Copyright and Terms & Conditions
© 2026. The Author(s). Published by the American Astronomical Society.