Image Details
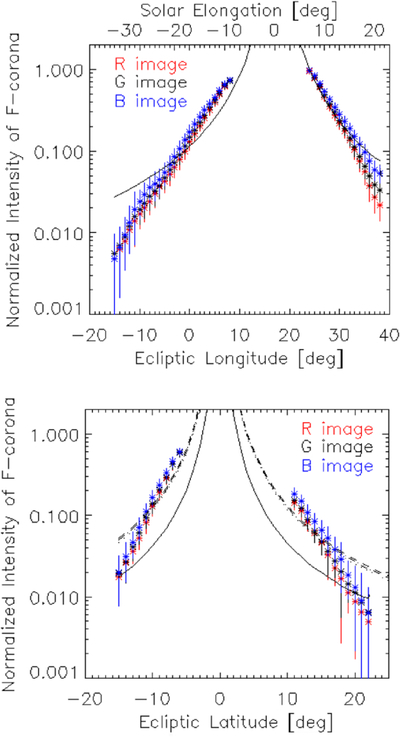
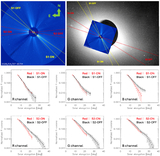
Caption: Figure 4.
Radial intensity profiles of the F-corona measured from the solar position along the ecliptic longitude (top) and ecliptic latitude (bottom) directions. An additional axis showing the solar elongation has been included in the top panel, while in the bottom panel the elongation corresponds to the absolute value of the ecliptic latitude. Red, black, and blue symbols denote the profiles in red, green, and blue channels, respectively. Error bars represent the standard deviation of pixel values within each spatial bin. The solid curve shows the ZL profiles calculated with ZodiSURF (R. O’Brien et al. 2026). The dotted, dashed, and dashed–dotted curves in the bottom panel represent three cases in which two of the three parameters (η, γ, and μ) are fixed at the original values in T. Kelsall et al. (1998), while the other is varied with η = 2.0, γ = 3.0, and μ = 1.0, respectively.
Other Images in This Article
Copyright and Terms & Conditions
© 2026. The Author(s). Published by the American Astronomical Society.