Image Details
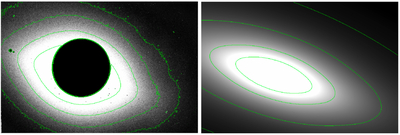
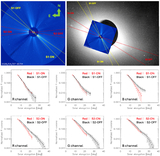
Caption: Figure 3.
Left: a normalized green channel image produced by masking the Moon and bright stars from the original art002e009301 image to extract the structure of the diffuse background emission. Right: a diffuse ZL map for the same field calculated using ZodiSURF (R. O’Brien et al. 2026) with the same normalization. Intensity contours of the diffuse light at levels of [0.01, 0.03, 0.1, 0.3] are overlaid for both images.
Other Images in This Article
Copyright and Terms & Conditions
© 2026. The Author(s). Published by the American Astronomical Society.
Copyright ©
2026 Astronomy Image Explorer. All Rights Reserved.