Image Details
Caption: Figure C1.
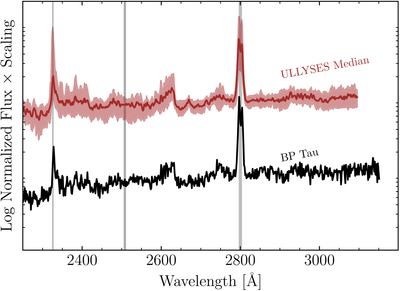
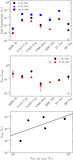
The G230L spectrum of BP Tau (black) compared with the median (brown line) and range (brown filled region) of G230L spectra of 50 CTTSs in the ULLYSES sample. The gray lines mark the locations of the NUV emission lines discussed in Section 4. Notice that there is no sign of the Fe II] emission feature at 2505 in either BP Tau or the ULLYSES sample.
Other Images in This Article
Copyright and Terms & Conditions
© 2025. The Author(s). Published by the American Astronomical Society.
Copyright ©
2025 Astronomy Image Explorer. All Rights Reserved.