Image Details
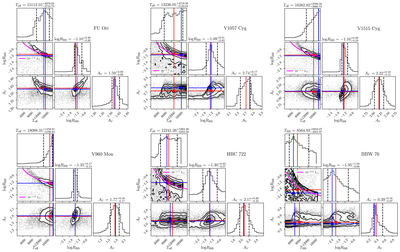
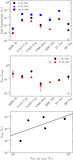
Caption: Figure B1.
The posterior distributions for the blackbody fit described in Section 3.2. The red vertical and horizontal lines mark the median values for the histogram, while the blue lines mark the modal values. The magenta line marks the ﹩{R}_{{\rm{BB}}}\propto {T}_{{\rm{BB}}}^{-2}﹩ relation, anchored at the median Lexcess value for each source.
Other Images in This Article
Copyright and Terms & Conditions
© 2025. The Author(s). Published by the American Astronomical Society.
Copyright ©
2025 Astronomy Image Explorer. All Rights Reserved.